Chapter 18 Tutorial material
18.1 Visual search
Here’s data from 1,725 PSYC2016 students for the visual search experiment you did.
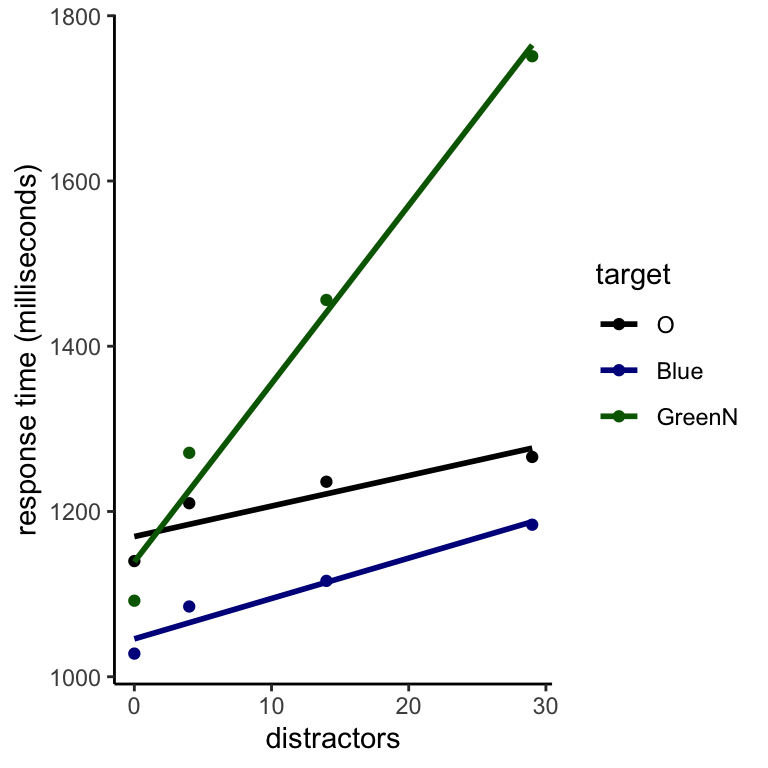
Figure 18.1: Results for a blue target (among differently-colored distractors), a green ‘N’ (among Ns of other colors and other letters that are sometimes green), and an ‘O’ (among other letters).
Why is the slope of the green ‘N’ target data steep and the other graphs shallow?